Visualizing Funnel Data: Best Practices and Techniques
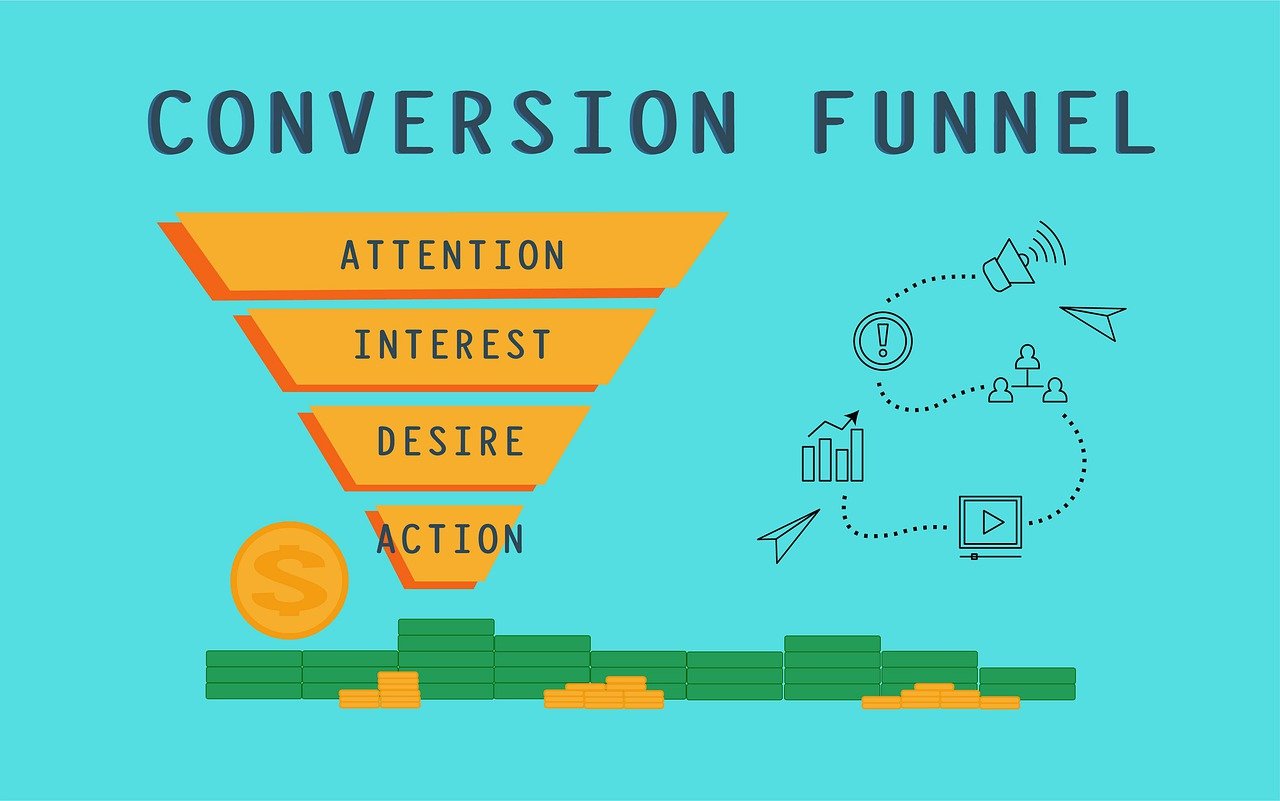
Marketing funnel analysis serves as a cornerstone to understanding customer behavior, a vital area for businesses. By analyzing the path customers take from awareness to purchase, marketers can identify bottlenecks and optimize processes. A common method to visualize this journey is through funnel charts, showing conversion rates at each stage distinctly. These charts help identify which stages are effectively driving conversions and which need significant improvements. In order to create impactful funnel visualizations, it’s essential to collect accurate data. This involves tracking metrics like clicks, leads, and sales. Tools such as Google Analytics can track customer interactions efficiently. Additionally, segmenting audiences by different characteristics can provide more tailored insights. Using different colors to represent stages in funnel charts can enhance understanding. Further, employing data visualization tools like Tableau can create dynamic visualizations that engage stakeholders. This allows marketers to convey the importance of their data clearly. Ultimately, a well-visualized funnel analysis allows for informed decision-making that aligns marketing efforts with business objectives and drives growth in a competitive landscape. Understanding these best practices transforms how businesses approach their marketing strategies.
To maximize the effectiveness of your analysis, it’s important to consider the design of your funnel charts. Clarity is the key aspect of any visual representation of data. Sticking to minimalistic designs ensures that attention is drawn to critical metrics rather than overwhelmed by excessive details. One effective technique is employing annotations that explain anomalies or spikes in the visual data. This provides viewers with immediate context. In addition, using comparative data from previous periods can illustrate performance over time, highlighting successes and opportunities for growth. This not only aids in context but also tells a story, enhancing engagement. Importantly, incorporating user feedback can lead to insights about the funnel stages that require further analysis. Structured feedback loops allow marketers to refine their analyses continuously. Moreover, ensuring that visualizations are mobile-friendly increases accessibility for team members who might need to view performance metrics while on the go. Easy access to data empowers team members to make timely decisions. Ultimately, prioritizing clear design and accessibility fosters a data-driven culture within organizations. Striving for seamless visualization experiences will guide strategy formulation and execution more strategically.
Key Metrics to Monitor in Funnel Analysis
When conducting funnel analysis, several key metrics demand attention for deeper insights. Conversion rates represent the percentage of users who move from one stage to the next, and these rates are pivotal for assessing effectiveness. The average drop-off rates at each stage signal areas where potential customers lose interest, allowing for targeted interventions. Additionally, understanding user behavior leading to conversions is equally vital. Metrics such as click-through rates or time spent on site before conversion provide valuable context. Another important metric is Customer Acquisition Cost (CAC), which provides insight into the cost-effectiveness of marketing strategies. High CAC may indicate inefficiencies in targeting or messaging. Conversely, the Lifetime Value (LTV) of a customer is crucial to compare against CAC. It provides a broader understanding of the financial impact of conversion rates. Tracking churn rates can reveal if customers are leaving after initial purchases, encouraging deeper analysis into brand loyalty. Each of these metrics contributes to a holistic view of the marketing funnel’s health. Prioritizing these metrics can inform strategic pivots, helping to optimize the customer journey and ultimately enhance revenue performance.
In addition to standard metrics, qualitative data plays a significant role in understanding customer behavior. Survey feedback can provide insights directly from customers about their experience moving through the funnel. Open-ended questions could relate to their purchasing decisions, feelings about brand messaging, or difficulties in navigation. This qualitative data supplements quantitative metrics, informing better strategies for engagement. A/B testing on different funnel stages can also reveal which designs or messages resonate with your audience. Implementing changes based on test results can lead to improved conversion rates and enhanced user experiences. Furthermore, utilizing heatmaps can illustrate how users interact with specific elements on your webpage. Heatmap analytics offer clues on which content draws attention or is ignored, guiding optimization. Remember to regularly refresh strategy and analysis to keep pace with changing consumer behaviors. Adapting to customer preferences is crucial to retaining competitive advantage. Staying agile ensures that marketing efforts continue to deliver results. Ultimately, blending quantitative and qualitative data fosters a comprehensive understanding of customer journeys, enhancing the ability to create targeted marketing strategies.
Tools for Effective Funnel Visualization
Leveraging the right tools for funnel visualization can substantially enhance data analysis capabilities. One popular choice is Google Data Studio, which allows for dynamic dashboard creation with real-time updates on key metrics. This tool integrates effortlessly with other Google services. Another option is Microsoft Power BI, known for its robust reporting and data visualization features. These functionalities enable marketers to customize reports for specific business goals. Tableau also stands out as a powerful tool for creating intricate funnel visualizations, with its drag-and-drop interface simplifying data arrangement. Additionally, leveraging CRM systems like HubSpot can help track and visualize customer interactions across all funnel stages. Integration with marketing automation tools can create comprehensive insights into customer journeys. It’s crucial to choose tools that offer flexibility and scalability to grow with your business needs. The right tool will empower teams to derive actionable insights quickly. Using visual storytelling formats increases engagement with stakeholders, turning raw data into a narrative that drives strategic decisions. Ultimately, the choice of visualization tools can make or break the effectiveness of your funnel analysis. Efficient tools foster collaboration and knowledge sharing among team members.
Incorporating best practices into your funnel analysis often leads to significant improvements in overall marketing performance. Regularly updating and reviewing funnel visualizations is crucial, particularly as market dynamics shift. Analyzing seasonal trends helps marketers anticipate changes and adjust strategies accordingly. Moreover, fostering a collaborative approach among marketing teams encourages diverse perspectives on data interpretation. Engaging cross-departmental teams in discussions can unveil insights that might have otherwise been overlooked. Continuous learning and adaptation based on data findings can drive innovation in marketing strategies. Hosting routine workshops to discuss results and brainstorm new approaches can also enhance the understanding of funnel analysis. It’s essential to benchmark performance against competitors to understand relative positioning in the market. Monitoring industry trends provides cues on potential shifts that may impact customer behavior significantly. Investing in ongoing training and educational resources fosters a culture of data literacy among marketing professionals. Building competency in data analysis enhances the organization’s overall capability to leverage analytics strategies. Ultimately, collaboration paired with adaptability is key. A data-driven culture sets the foundation for sustainable competitive advantage in the dynamic landscape of marketing.
Conclusion: The Future of Funnel Visualization
The future of marketing funnel visualization lies in integrating advanced technologies like AI and machine learning. These technologies can help predict customer behavior based on historical interactions dramatically. Embracing these developments allows for more precise targeting of prospective buyers, enhancing the effectiveness of marketing campaigns. Automation tools will streamline reporting processes, freeing time for strategic thinking. Data visualization trends, such as real-time analytics and interactive dashboards, are already shaping how marketers interpret funnel data. The advent of augmented reality and virtual reality also promises to revolutionize how data is represented visually, providing immersive experiences for stakeholders. Continually evolving methods to convey data to diverse audiences is crucial for long-term success. Data storytelling will take center stage, as stakeholders seek messages that resonate. Therefore, honing skills to translate complex data into captivating narratives is essential. As marketers face greater competition, the ability to adapt and innovate in data visualization will prove beneficial. Keeping abreast of industry advancements in analytics fosters an organization’s ability to remain agile. Ultimately, integrating technological advancements will enhance the overall effectiveness of marketing funnel analysis, driving toward future success.
In conclusion, marketing funnel visualization plays a critical role in every marketing strategy. Through effective practices and techniques discussed, businesses can significantly enhance their understanding of consumer behavior and optimize conversion paths. Using the right tools, focusing on key metrics, integrating qualitative data, and staying adaptable ensure that marketers meet evolving customer needs. By fostering a culture of data-driven decision-making, organizations place themselves in a premier position to innovate continuously. Future advancements in technology will further enhance capabilities, and examining these developments closely remains essential. Finally, organizations should prioritize collaboration and training to elevate their marketing strategies in increasingly competitive environments. Investing in data literacy and continuous learning solidifies a foundation for sustainable growth. In this journey, consistency remains paramount, urging marketers to regularly revisit their strategies as customer expectations and market conditions change. Therefore, embracing an iterative approach will refine analytic processes over time. In this dynamic marketing landscape, staying informed and agile equips teams to meet customer challenges head-on. Thus, visualizing funnel data effectively not only aligns with business goals but also empowers marketers to create meaningful connections with customers.